


This article was originally posted as a feature on the Social Media Examiner.
As an emerging platform, TikTok represents a unique opportunity for brands looking to drive more engagement with younger audiences. According to SensorTower, TikTok has received more downloads than Instagram in the first half of 2019. Over the past 5 consecutive quarters, TikTok has also topped the iOS App Store for overall downloads.
With over a billion total downloads, it’s the first platform that’s rivaled Instagram and Facebook in terms of scale. In fact, Instagram has recently started integrating similar features from TikTok into its platform in a bid to engage younger audiences.
Although a popular consumer app, TikTok has a long way to mature before winning the hearts of digital marketers. Although the platform hosts are large user base, its unique format of content can leave brands uncertain on where to begin. As most brands are also awaiting a self-serving ad platform, it can be difficult to determine if the platform is worth prioritising.
Another major downfall for TikTok was its lack of analytics to measure the performance of content. With no in-app analytics tools, it was difficult for brands to attribute platform outcomes from the resources they were allocated. It also meant that brands partnering with influencers weren’t able to measure the effectiveness of these collaborations.
It’s only recently that TikTok has quietly launched a native analytics tool for TikTok pro accounts. This new analytics dashboard is an effective way to identify insights about an overall audience and the performance of published content.
TikTok pro accounts are similar to Instagram creator accounts. In its current state, the account format entitles you to analytics and other new features.
The process of updating to a pro account is intuitive to follow and takes less than a minute to complete. To update your account, simply head to the settings page of your profile.
From there, click the ‘Manage your account option’. At the bottom of this page, you’ll see an option to switch to a TikTok pro account.

Next, you’re prompted to select a featured category for your account. The categories include Public Figure, Personal Blog, Education, Media, Entertainment, and more.

Once you register a pro account, you can then navigate back to the settings menu. From here, you’ll now see an option to open your analytics dashboard.

Note: TikTok analytics will only start recording data from this period. The dashboard won’t display any historic data. You’ll need to wait up to 7 days for your account to generate enough data to start displaying insights. Throughout this period, I’d recommend publishing as much content as possible to garner deeper insights.
Once data starts populating, you can dive into your account insights. As with all analytics, this data will become more accurate over time as you publish more content.
Measuring TikTok Analytics
There are 3 main categories that TikTok displays within your account dashboard. These include:
- Profile overview
- Follower insights
- Content insights
Each of these pages allow you to dive deeper into each category to uncover new insights.
Profile Overview
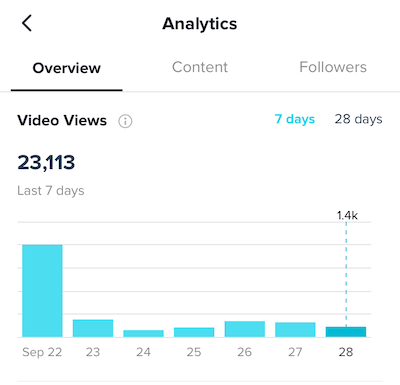
The profile overview page is a useful way to identify how well your profile is performing overall. This page will summarise your total video views, profile views and follower count.
Video Views
This dashboard will display your overall video views from the past 7 or 28 days. This data is displayed on a per-day basis.
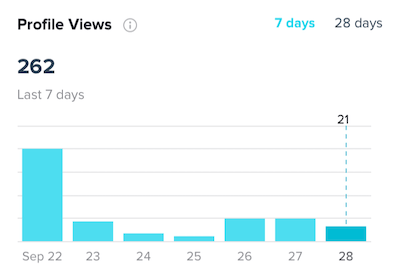
Profile Views
Profile views will display how many total users have visited your profile page. As this is again displayed on a per-day basis, you’ll start to identify which content drives users to your page.
Follower Count
The followers graph will display the data from your total follower count. Again, this can be broken down into 7 or 28 day periods.
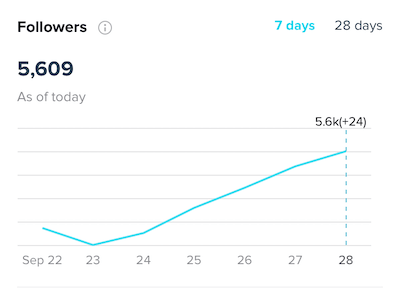
Follower insights will allow you to attribute any popular videos with overall account followers. By understanding which days you publish content and aligning it to follower growth, you can determine that this content isn’t just enjoyable to watch, but was so engaging that it drove users to follow your brand.
I like to use the data provided on the profile overview page to interpret a funnel of users – starting with those who begin consuming your content, through to those who become engaged followers.
This makes it possible to identify your conversion rate from your total video views, through to users who visit your profile, then the conversion rate of those who actually followed your profile.
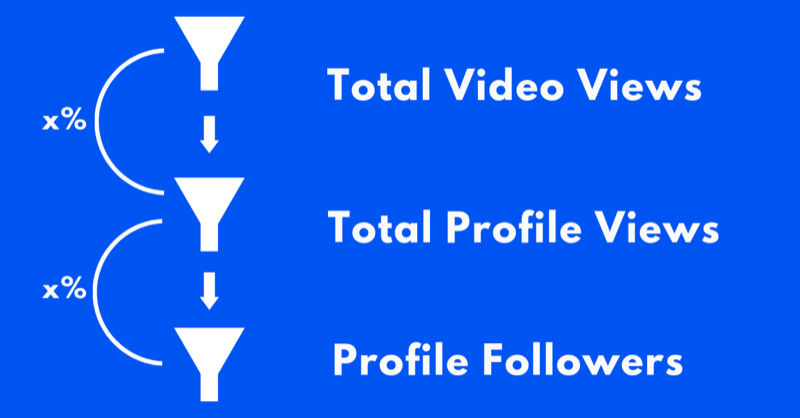
This will help you understand how to prepare an effective content strategy. When you have a clear understanding of your content conversion rate, you can start to forecast a posting schedule and accurately determine your account growth rate.
The data presented on the overview page is certainly not the most advanced analytics, but it can be used in strategic ways to your advantage.
Followers Page
The followers dashboard will display a topline view of your audience demographics. Similar to Google Analytics, it will showcase an overview of your audiences gender split, as well as a percentage breakdown of your audience by location.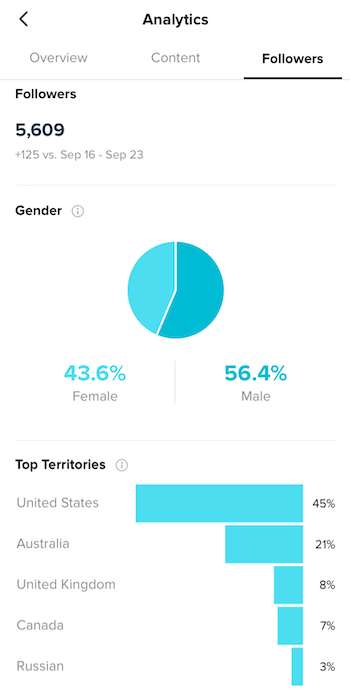
As TikTok has largely scaled across foreign countries, you can expect to see quite a diverse breakdown from these territories.
Content Page
The content analytics page is by far my favourite as it offers the richest insights.
On a top-level view, this page will display the total views of each post from the past 7 days.
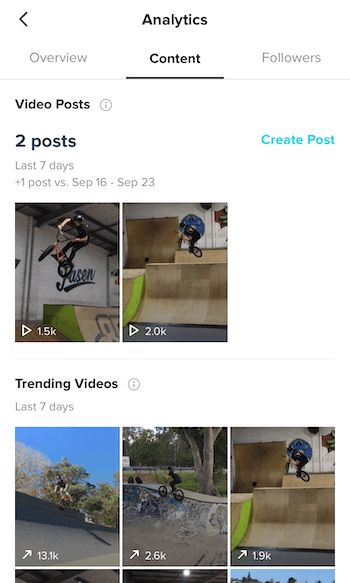
It will also display which of your videos have been trending on the for your page within this period, as well as a total of how many views they’ve accrued throughout the process.
My favourite feature of the content analytics is the ability to dive into each unique post and uncover richer insights. To view the analytics of each post, simply click on the post thumbnail to open its unique dashboard. The analytics of each post will uncover:
- Total like count of post
- Total amount of comments
- Total shares
- Total video views
- Total playtime of video
- Traffic sources
- Audience territories
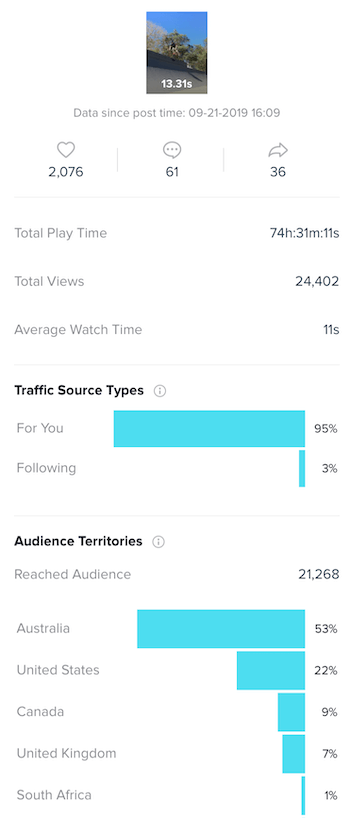
My favourite data to analyse is the audience territories. This key insight will allow you to identify if particular pieces of content resonate with different audience demographics.
By reviewing the territory engagement from individual posts, you can compare this data to your overall audience territories that I mentioned in the profile analytics page. This will help uncover if different forms of content resonate with new audiences from different locations. If you notice particular posts perform better in certain locations, you can double down on replicating more content like this.
Although TikTok’s native analytics tool can be useful for uncovering data on your own profile, it’s not possible to divulge insights about the performance of profiles you don’t own.
If you’re a brand looking to uncover insights about potential influencer profiles, or you’re even trying to understand how your competitors profiles perform, TikTok is unable to share any useful data.
With no public TikTok API, existing influencer platforms have lacked the ability to display valuable data on public accounts.
Determined to uncover a solution for sourcing TikTok influencers, I recently stumbled across a platform called Pentos. Pentos leverages publicly available profile data to display insights on Tiktok accounts.
As far as I’ve seen, this is currently the only analytics solution available to measure data from third-party TikTok accounts. Pentos allows you to analyse the performance of accounts, as well as insights on trending hashtag challenges.
Getting started with Pentos is free and allows you to track up to three accounts. There’s also paid tiers of the tool depending on the usage you require. Unlike TikTok’s native analytics tool, Pentos will begin displaying historic profile data immediately from the time you select an account.
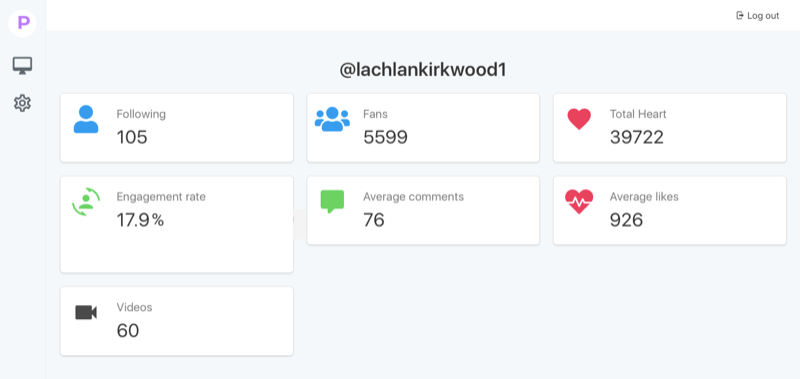
To begin using the tool, simply add the users profile handle you’d like to track. This will then open a dashboard displaying the data for the account. This data will include:
- The profiles average engagement rate
- Total hearts
- Total number of videos posted
- Average likes
- Average comments
- Total number of accounts a profile follows
Below these initial insights, the tool will also map a graph to indicate how this data is historically attributed.
You’ll notice that unlike TikTok, Pentos identifies an average engagement rate for profiles. If you’re a brand looking to partner with an influencer, this an important metric to evaluate.
Average engagement rates across TikTok can vary from Instagram. According to Influencer Marketing Hub, the average engagement rates for TikTok accounts are:

You’ll notice that these average engagement rates are much higher when compared to Instagram. TikTok presents a valuable opportunity for brands currently working with influencers across their digital marketing strategy.
Beyond profile analytics, Pentos is also able to uncover insights about hashtag challenges. This is a powerful tool for brands looking to remain agile and create content for highly engaged topics. By identifying the performance of trending hashtags, brands can quickly determine if it’s worth creating content for relevant challenges.
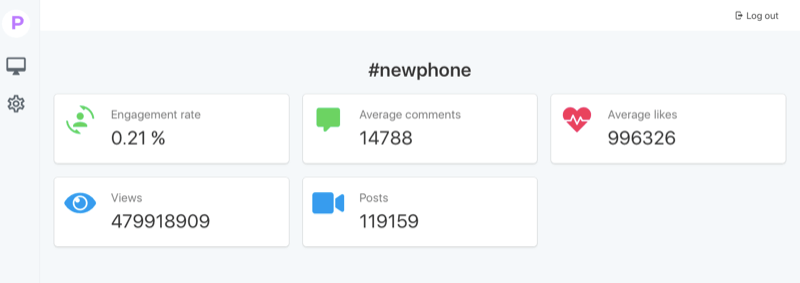
The hashtag challenge dashboard will uncover some valuable insights, including:
- Average hashtag engagement rate
- Total views of hashtag content
- Total number of posts
- Average likes

Let’s say you’re an eCommerce brand that sells custom phone accessories and you notice the hashtag challenge, #newphone is trending across the discover page.
As hashtag challenges on TikTok can be timely and based on current trends, it’s important for you to quickly publish content before the hashtag becomes saturated or obsolete. By using the hashtag insights tool, you can identify how many total posts the hashtag currently hosts, as well as it’s average engagement rate.
In this instance, the #newphone hosts an engagement rate of 0.21% for the overall hashtag. As a comparison, I’ve found hashtag challenges to have an average of 0.15 – 0.3% engagement rate overall. By using this data-driven approach, it’ll help develop a more strategic path for your TiKTok content plan.
To create a hashtag dashboard in Pentos, follow a similar setup process to the profile analytics. Simply enter the hashtag you’d like to follow. Once validated, the dashboard will populate with up-to-date data.
In another scenario, the hashtag analytics tool provided by Pentos can be a useful way to measure the performance of a branded hashtag challenge you create.
Between the use of TikTok’s native analytics and Pentos’ third-party tool, it’s now possible for brands to attribute the performance of their content across the platform. If you’re a brand who has been curious to start trialling TikTok as a social channel, now truly is a great time to get started. With analytics finally accessible, you can easily monitor the results from the platform and iterate your strategy accordingly.
Of course, before jumping into the platform, it’s important to identify if TikTok is an appropriate fit for your brand. If your target audience doesn’t include the average user of the platform, it might not be worth allocating the resources to experiment.
If you do decide to start using TikTok, I’d recommend understanding what real value it can provide to your business. Beyond driving just engagement, it’s important to determine if the platform will help you to acquire users or drive conversions.
Similar to Instagram, I’d encourage brands to include a link within their profile bio. Unfortunately on TikTok, urls added into a bio are not able to be clicked, so it’s important to utilise a link shortening tool to streamline the process for end-users.
To attribute not only the traffic of your profile link, but also the conversions the platform generates on your first-party site, I’d encourage brands to create custom behavioural flow reports in Google Analytics. This will allow a brand to clearly understand the number of users who are driven to the website through TikTok, then go on to complete a conversion event.
As a new feature, TikTok analytics has potential to continue evolving into a valuable dashboard for brands. I’m looking forward to seeing the additional data points that are added to pro accounts.
____________________________________________________________________________________________
 ⠀⠀⠀⠀
⠀⠀⠀⠀
About me:
I’m a twenty-four-year-old Digital Marketing & Conversions Specialist based in Brisbane, Australia. With a passion for all things digital and tech, I aim to connect and learn from as many like-minded digital enthusiasts as possible. If you have a passion for emerging technologies and digital practices, I’d love to connect and hear your story.
